Gaia Pleiades Member Finder
Which stars are likely to belong to the Pleiades cluster, rather than just appearing nearby in the sky?
Why this question matters
The Pleiades is a group of stars that formed together. Unrelated stars can appear in the same direction, so an image alone cannot establish membership. Gaia measured positions over time: small annual shifts provide distance information, while longer-term changes show movement across the sky. Shared distances and motions help identify likely members.
Cluster stars formed at roughly the same time. A useful member list lets astronomers compare stars of different masses at a similar age and test how stars change over time. Including unrelated stars or excluding genuine members can distort the patterns a later study tries to explain.
What this project does
This project uses archived Gaia DR3 measurements in a filtered field with a 5° radius around the Pleiades. It groups stars by parallax, the annual positional shift, and proper motion, their movement across the sky. The known approximate Pleiades distance and motion identify which group to examine.
It then applies an explicit rule to produce a candidate list, checks the stars’ other measurements and compares alternative rules and a published catalog. The result is a targeted, inspectable selection rather than a blind discovery of a cluster.
What the project found
The original rule selects 866 candidate stars from 12,520 quality-filtered Gaia DR3 sources. Stricter rules produce smaller lists, and changing the measurements used in the fit changes which stars are retained.
The candidates share Pleiades-like distances and motion. Their color and brightness form a recognizable stellar pattern, but that check reuses the selected parallaxes and the input already required usable photometry. It is not independent confirmation of membership.
The list records each candidate’s measurements and the selection rule. It does not confirm every star as a member, show that it is gravitationally bound to the cluster or provide a complete Pleiades census.
What the figure shows
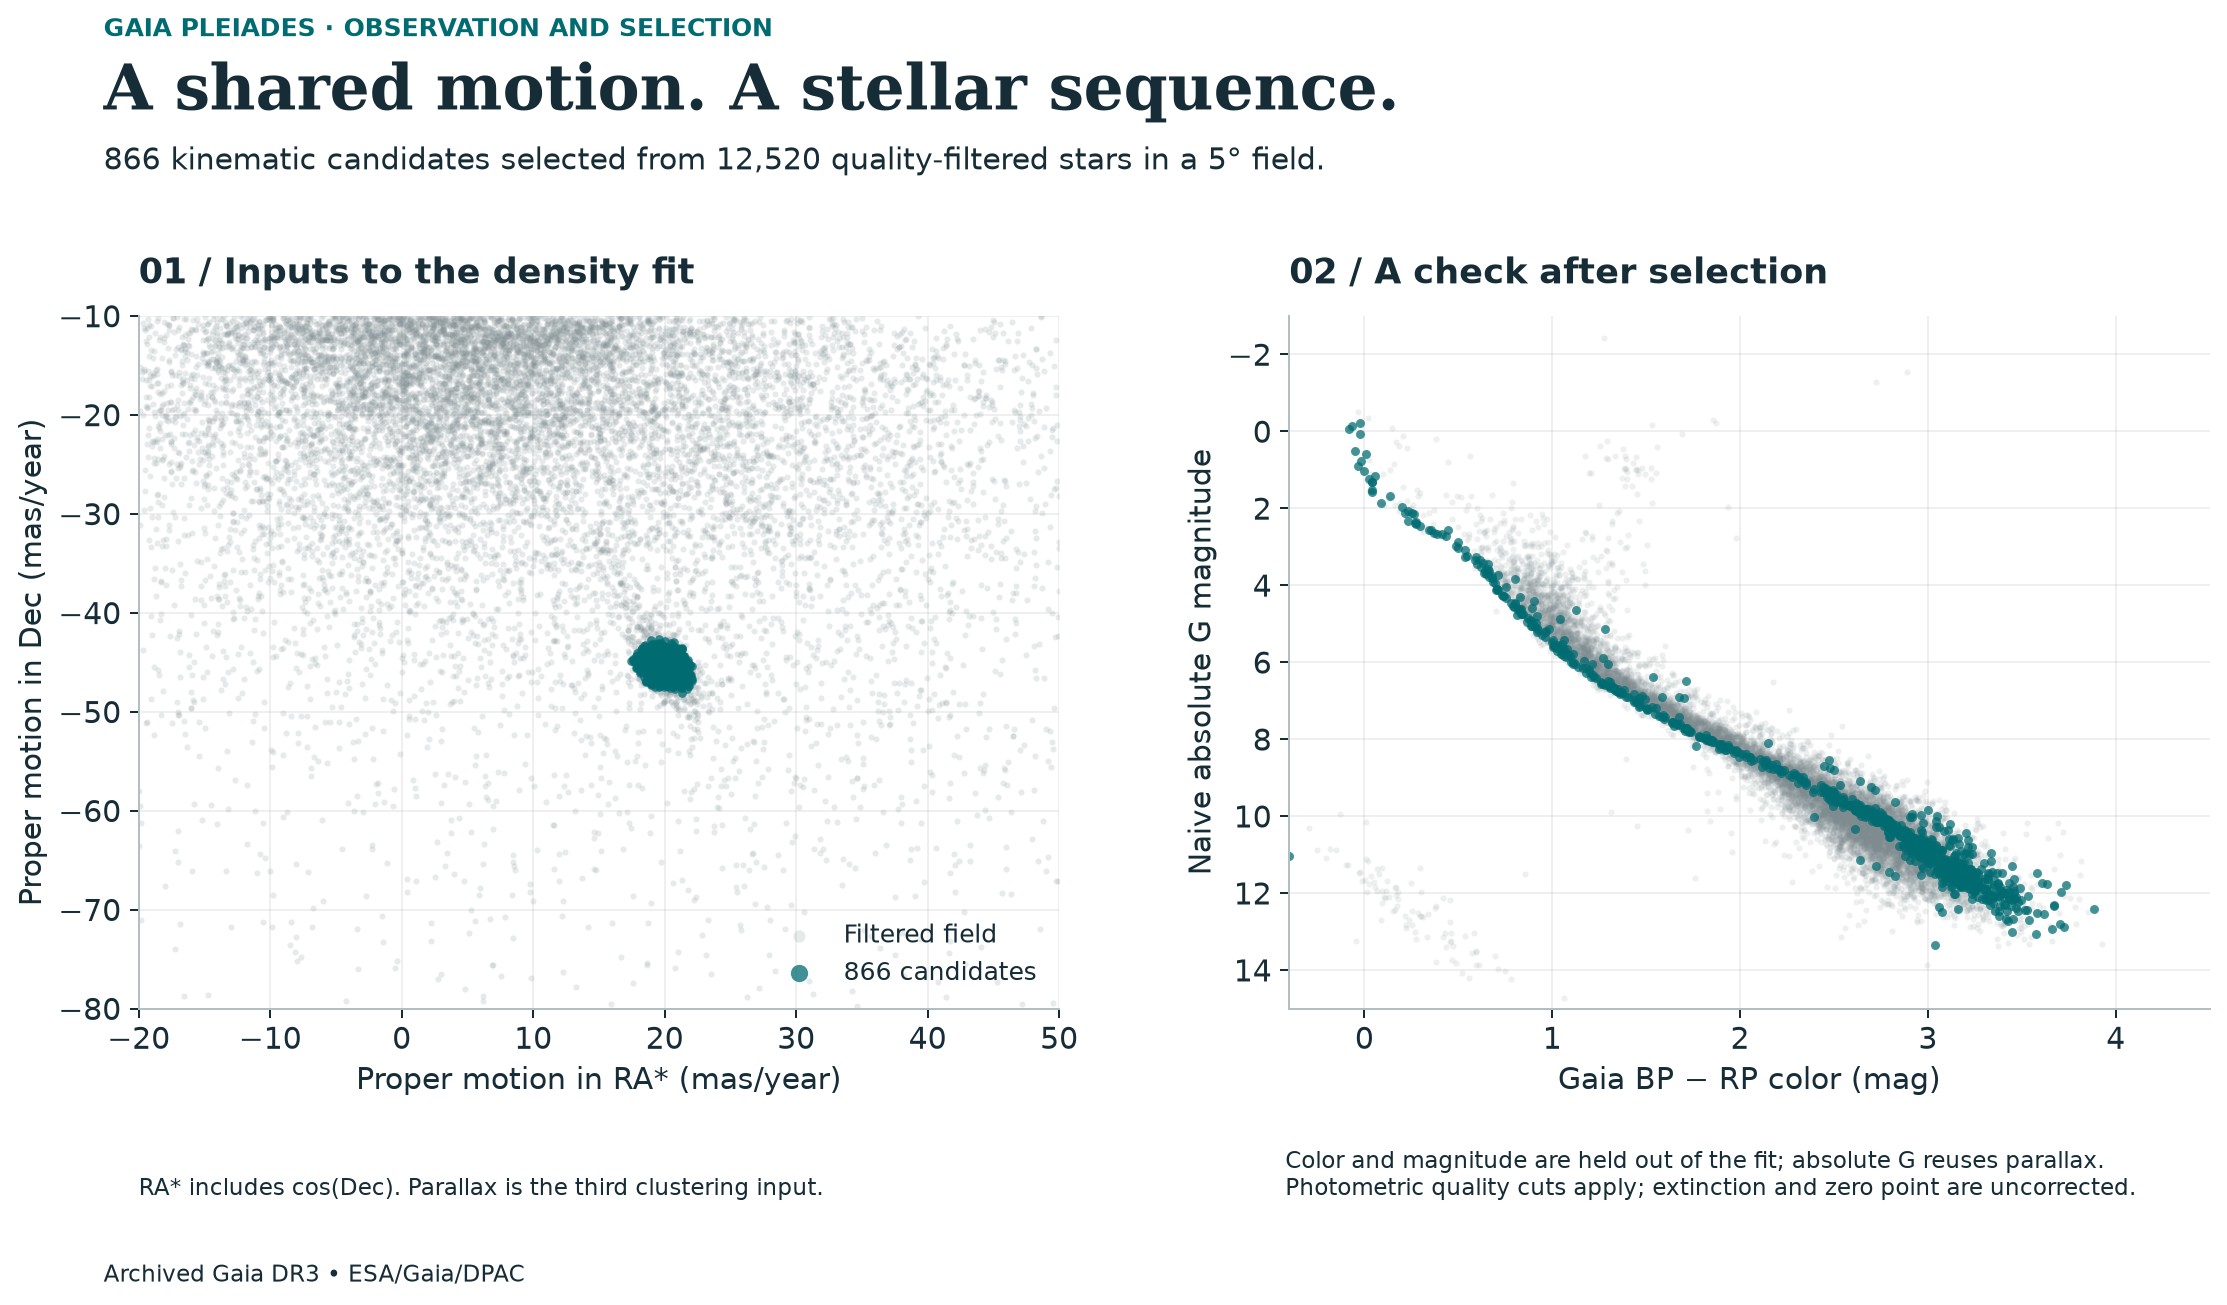
In the left panel, selected candidates form a compact group in motion across the sky. In the right, the same candidates trace a recognizable color-and-brightness sequence. That check reuses the selected parallaxes and does not independently confirm membership. Together the panels show the selection and a check on its stellar pattern.
The right panel does not independently confirm membership. Color and brightness were withheld from the fit, but the distance-adjusted brightness reuses parallax and the input required usable photometry. No correction for dust extinction or Gaia’s parallax zero point is applied. Of 12,520 filtered Gaia DR3 sources, 866 meet the candidate rule.
RA* and Dec label the two directions of motion, measured in milliarcseconds per year. BP − RP compares Gaia’s blue and red brightness measurements; larger values indicate redder stars. Absolute G magnitude adjusts apparent brightness for distance, with smaller numbers meaning brighter stars.
Data: ESA/Gaia/DPAC, Gaia DR3. Comparison catalog: Hunt & Reffert (2024), CDS VizieR J/A+A/686/A42.
Technical details and limits
Read the methods, checks and limitations
Methods & checks
The clustering method, HDBSCAN, finds groups in parallax and the two proper-motion measurements. The chosen group contains 1,288 stars. Requiring an assignment strength of at least 0.5 leaves 866 candidates.
Assignment strength measures how firmly the method places a star in its fitted group. It is not a calibrated probability of physical membership. The delivered list records the stars, their measurements and the rule used to retain them.
The retained settings use 10th–90th percentile robust scaling to put the measurements on comparable scales, scikit-learn HDBSCAN with minimum cluster size 50, and min_samples 10.
Reproduction uses the same July 10, 2026 Gaia DR3 acquisition and returns identical candidate identifiers and assignment strengths. No new observation or archive query was made.
Color, brightness and radial velocity—the movement toward or away from us—are withheld from the clustering fit and used for checks. The color-and-brightness pattern is not independent confirmation: the brightness calculation reuses selected parallaxes, and the initial sample already required usable photometry.
Only 229 candidates have radial velocities with reported errors below 5 km/s. This subset favors brighter stars and cannot validate the whole list.
Of the 866 candidates, 781 also appear in the specified Hunt–Reffert comparison subset: 90.2% overlap. Both selections use Gaia data and related density methods, so agreement cannot be read as ground-truth accuracy.
The same 781 stars are 89.6% of the 872 reference stars eligible for this input sample, or 77.0% of the full 1,014-star reference subset. Stars missing from the filtered input cannot be selected.
Stricter assignment-strength rules return smaller lists: thresholds of 0.3, 0.5, 0.7 and 0.9 retain 1,099, 866, 582 and 254 candidates. Removing parallax from the fit adds 82 stars and loses 62, even though the input was already filtered by parallax.
A simple fixed rectangle in distance-and-motion measurements selects 1,196 stars and includes all 872 eligible reference stars. These comparisons reveal how the rules change the list; they do not establish which selection has fewer unrelated stars or is physically superior.
Code & sources
Public repository with archived Gaia data and saved outputs
Input filters, clustering settings and comparison definitions
Code and saved results for the additional checks
Stellar motion, color and brightness with shared-input limits
Saved alternative candidate selections, counts and comparison denominators
The input sample, selected group and final rule
Shared stars and the three comparison denominators
Candidate counts at four assignment-strength thresholds