Ghostlight
Can light from a nearby star lead to a misleading measurement of gravitational lensing?
Why this question matters
A black hole without bright gas around it can still bend light from a star behind it. As the objects move into alignment, the background star can appear brighter and its apparent position can shift. This is gravitational microlensing: the telescope receives starlight, and the unseen object is detected through its effect on that light.
The positional shift carries information about the unseen object. Combined with additional distance information, it can help estimate the object’s mass and assess whether it could be a black hole. Light from a nearby star can complicate that measurement if the telescope cannot distinguish the two stars separately.
What this project does
Ghostlight simulates the background star, the lensing effect and light from a second star. It compares a model that allows the second star to occupy its own position with one that forces it onto the background star’s position.
Because the true lensing signal is known in the simulation, the study can check both the estimated value and its reported uncertainty. It also calculates the pattern left unexplained by each model. No telescope observations are analyzed.
What the project found
Forcing the two stars onto the same position misses the known lensing value more often, even though the reported errors are almost the same size.
The incorrect model also leaves a clear pattern in the residuals: the differences between its predictions and the known simulated signal. An ordinary check of those differences should reject it under the tested conditions. Small reported errors alone therefore cannot establish that the measurement is trustworthy.
This is a simulation of a specific measurement problem. It has not found a black hole, measured a real object’s mass or established how often this problem occurs in telescope data.
What the figure shows
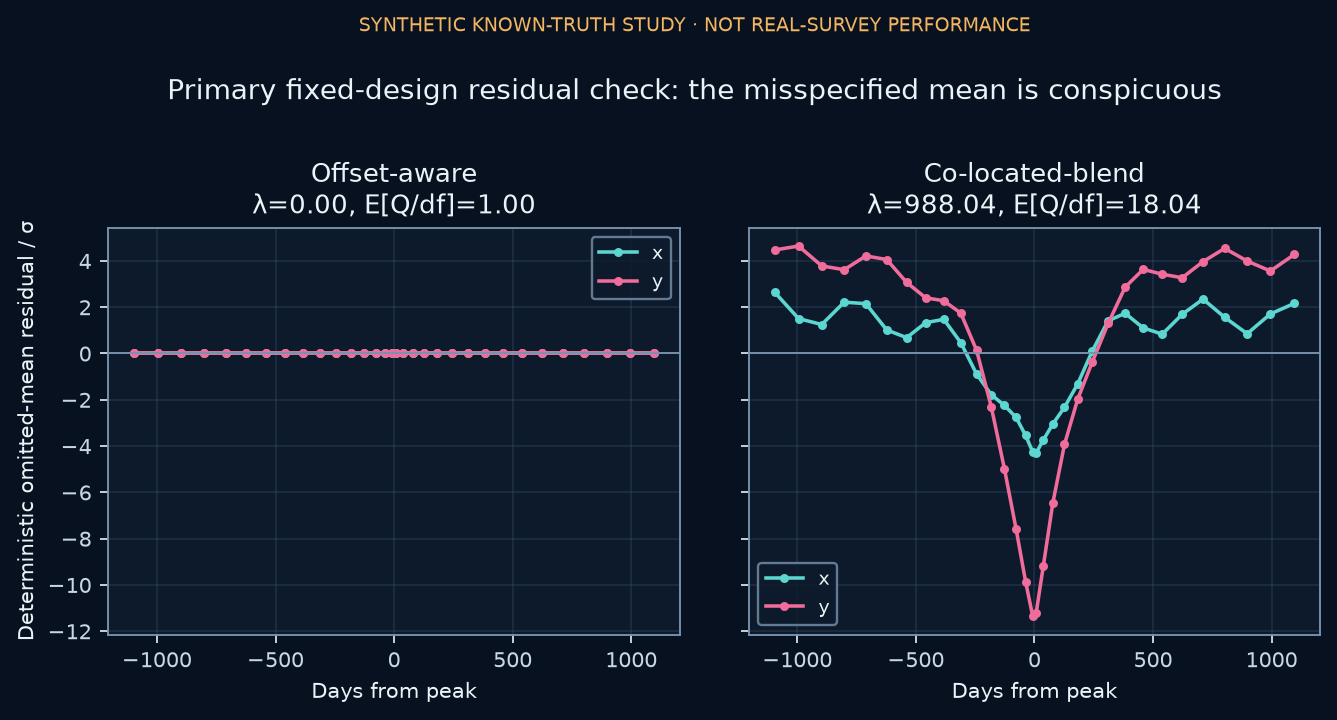
These calculated curves come from a simulation, not telescope observations. The left panel allows the second star its own position; the right forces it onto the background star. The curves show the mean signal left unexplained. The right panel’s strong pattern shows why checking that signal should expose the incorrect model.
The horizontal axis measures days from peak lensing brightness. The x and y curves represent two directions on the sky. Residuals are divided by the assumed measurement noise, labeled σ. “Offset-aware” and “co-located-blend” are the names of the two models.
Expected reduced Q, labeled E[Q/df], measures unexplained variation relative to noise: 1.000 versus 18.035. The symbol λ summarizes the squared size of the unexplained mean signal relative to noise. These curves were calculated from the declared simulation; they are not telescope observations or noisy trial residuals.
Source: Ghostlight’s saved deterministic residual audit.
Technical details and limits
Read the methods, checks and limitations
Methods & checks
Each noisy dataset is fitted twice. Both models receive identical noisy measurements and exact knowledge of the stars’ brightness ratio and the alignment inferred from brightness changes.
The fitted quantity is the angular Einstein radius: the angular scale of the lensing effect. The model that allows a second-star offset and the model that forces the stars together are compared using the same simulated data.
Interval coverage is the fraction of reported uncertainty intervals that contain the known true value. Across 2,000 paired simulated datasets, coverage of the 95% intervals is 95.80% for the model that allows the second star’s offset and 80.70% for the model that forces the stars together.
The reported standard errors barely change: 0.3618 and 0.3611 milliarcseconds, respectively. A milliarcsecond is a small unit of angle on the sky.
The difference in coverage is 15.10 percentage points, with a Monte Carlo 95% interval of 13.28–16.92 points. This interval describes uncertainty from the finite number of simulations under these fixed conditions. It does not describe performance across real lensing events.
A later calculation examines residuals, the positions left unexplained by each model. The model that allows the offset reproduces the declared mean signal; the model that forces the stars together leaves a strong pattern.
Its expected residual statistic, reduced Q, is 18.035 rather than 1.000. An ordinary residual test has effectively 100% calculated power to reject the incorrect model in this design. These are calculations from the known simulated signal, not measured rejection rates from telescope data.
Code & sources
Public repository for this simulated lensing study
Assumptions, uncertainty calculations and residual test
Calculated model differences and their limits
Source license retained with the figure