Anatomy of a Little Red Dot
What can three JWST spectra tell us about the light from distant little red dots?
Why this question matters
Little red dots are compact, distant objects seen in JWST images. Their light can include stars and gas around growing black holes. JWST records how much light arrives at each wavelength, producing a spectrum. Light emitted at shorter wavelengths reaches the telescope stretched into the infrared.
Stars and gas can leave different patterns in a spectrum. Understanding those patterns helps test explanations of the light, with consequences for estimates of stellar content and black hole growth in the early universe.
What this project does
This project analyzes real public JWST spectra of three objects. It accounts for the wavelength shift during travel and compares light in two ranges near the Balmer limit, a wavelength associated with hydrogen absorption.
The analysis checks how measurement uncertainty, the extraction of light from telescope data and overlapping emission affect the size and interpretation of the contrast. It delivers measurements and model comparisons for these three objects, including cases that remain poorly constrained.
What the project found
Two objects have substantially more light in the longer-wavelength band. The third object’s uncertainty allows equal brightness in the two bands. These are measurements of total light across wavelength ranges, rather than an isolated sharp edge.
For The Cliff, the shorter-wavelength light is so faint that some measurement choices leave the ratio without a finite upper bound. A model that stays continuous at the Balmer limit, with overlapping emission added, also describes the two strong contrasts.
The observed contrast therefore does not uniquely require a sharp edge. The analysis does not settle whether stars or a black hole supply the light, or establish a result for every little red dot.
What the figure shows
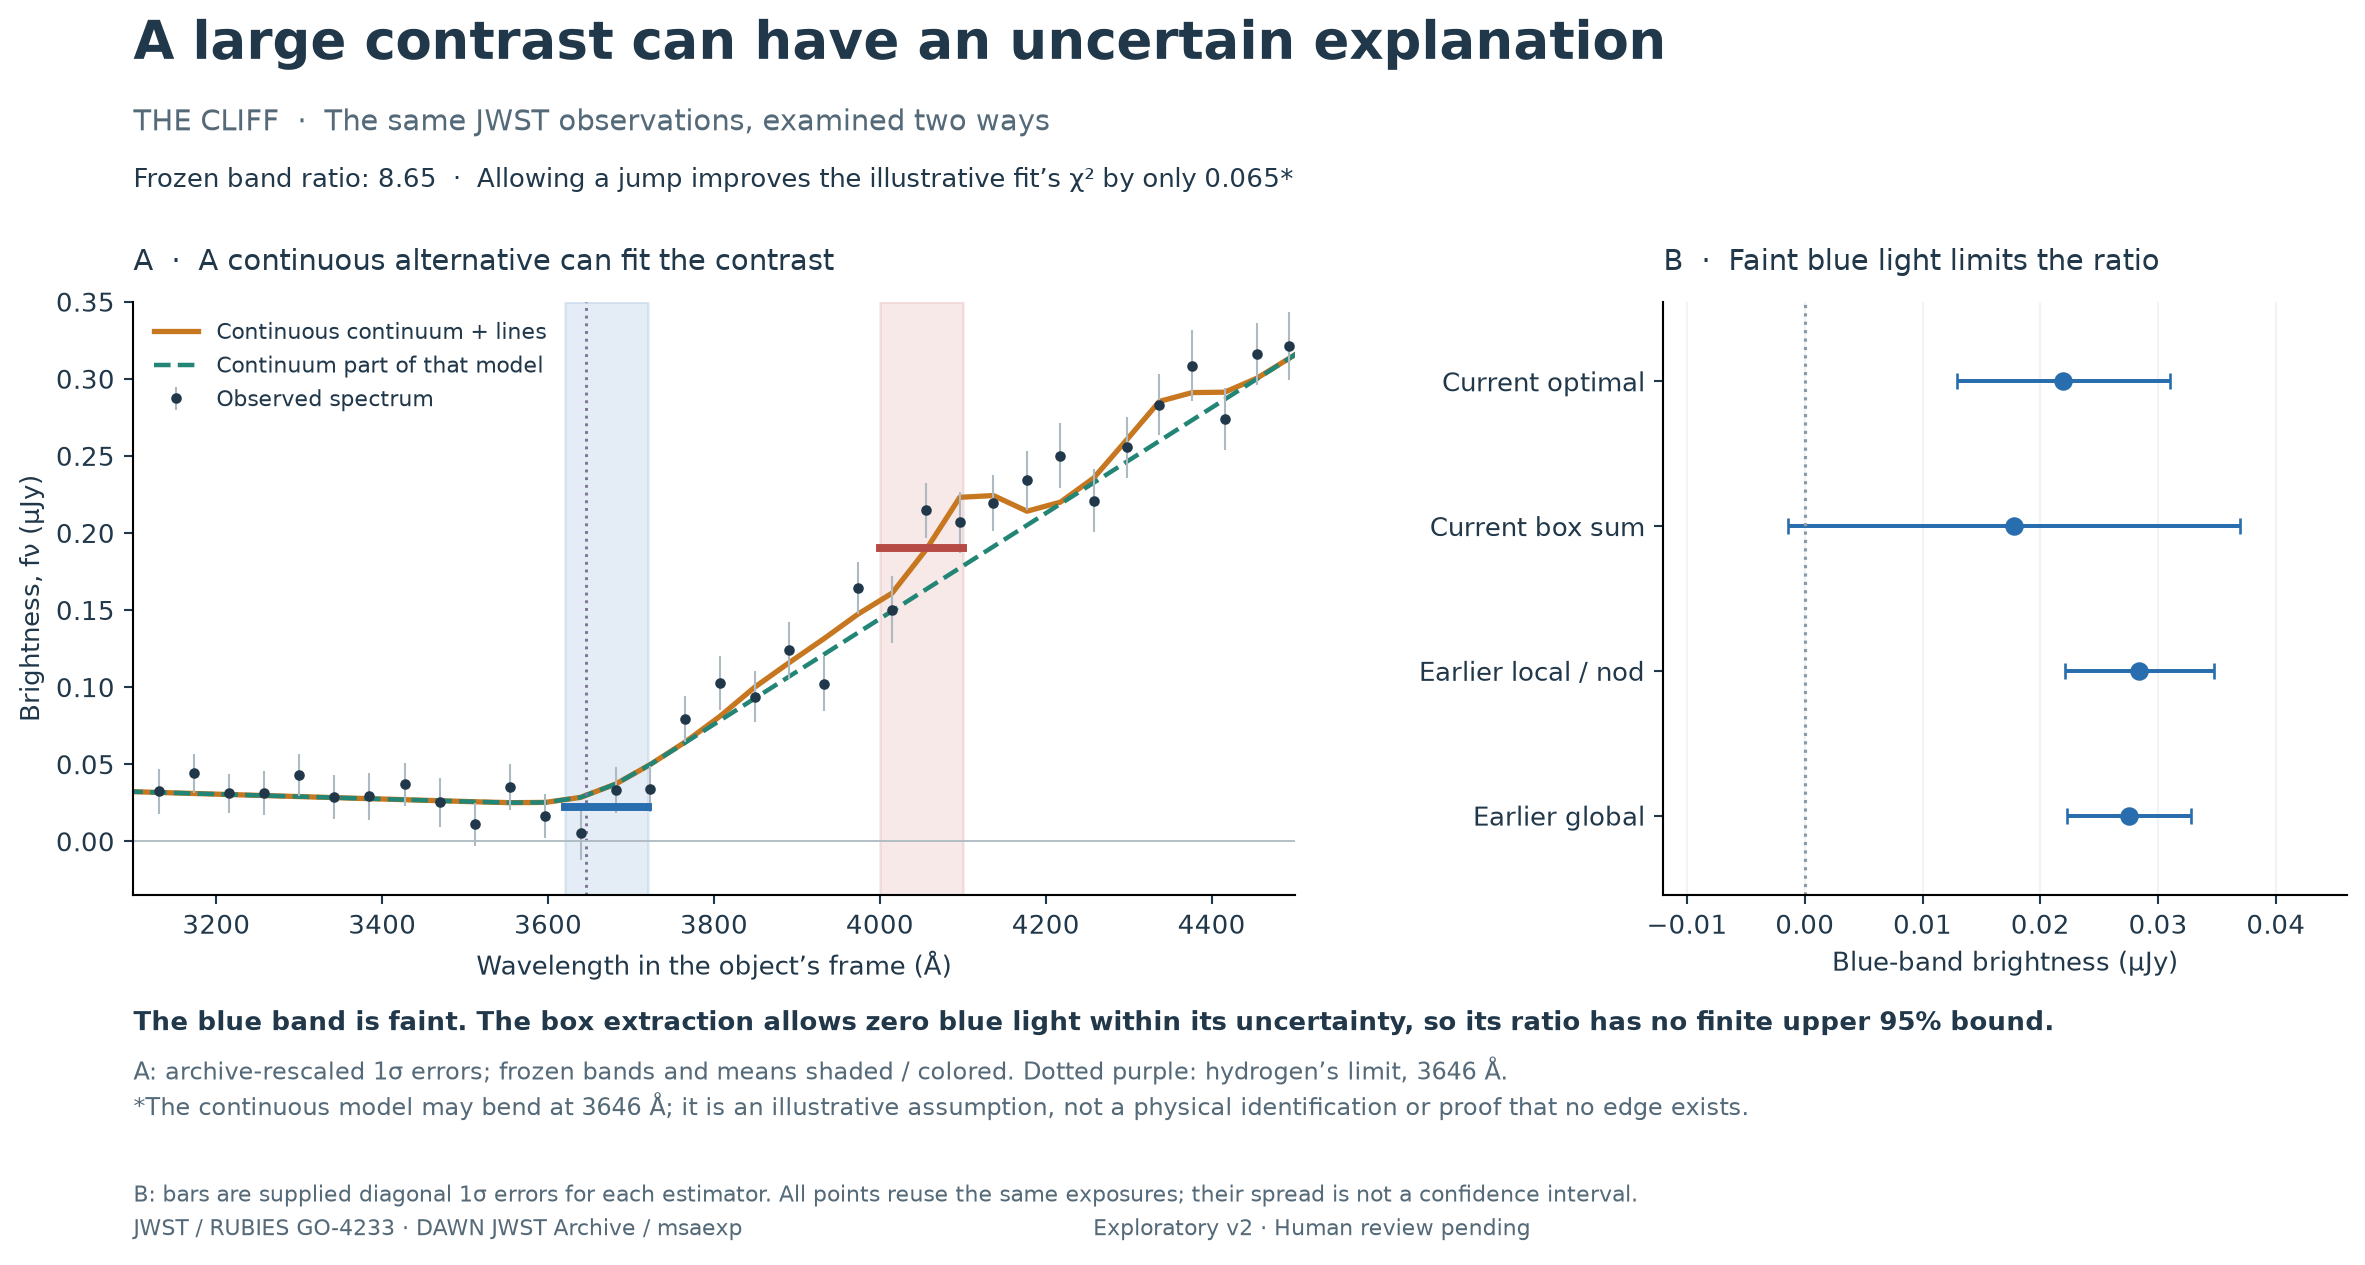
The left panel compares The Cliff’s observed JWST spectrum with a model that changes slope but stays continuous at 3646 Å. Added emission features help the model follow the contrast. A strong difference between the shaded wavelength bands therefore does not uniquely require a sharp jump.
The right panel shows how different weightings or reductions measure the faint shorter-wavelength light in the same exposures. The fixed-box estimate includes zero within its formal error. Its positive longer-to-shorter wavelength ratio consequently has no finite upper 95% bound. These are correlated measurement choices, not independent observations.
“Continuum” means the broad underlying shape of the light; “lines” are the overlapping emission features added to it. “Optimal” denotes a weighted extraction. Wavelengths are corrected to the object’s frame; Å is a unit of wavelength and µJy a unit of measured brightness. The panels identify their different error assumptions. The model does not physically separate the light sources.
Data: NASA/ESA/CSA JWST; RUBIES GO-4233 (Anna de Graaff, Gabriel Brammer); DAWN JWST Archive / msaexp.
Technical details and limits
Read the methods, checks and limitations
Methods & checks
The original longer-to-shorter wavelength ratios are 8.65 for The Cliff, 3.05 for RUBIES-BLAGN-1 and 1.19 for RUBIES-UDS-182791. Their original 95% intervals are 4.55–67.10, 2.35–4.17 and 0.90–1.60, respectively, using archive-rescaled errors treated as independent.
The shorter-wavelength band spans 3620–3720 Å and straddles the 3646 Å Balmer limit; the longer-wavelength band spans 4000–4100 Å. These wavelengths refer to the light at emission. The ratios compare total band light, not an isolated edge. The third object’s interval includes equal band brightness.
Different weightings and reductions of the same telescope exposures test the faint shorter-wavelength signal. For The Cliff, summing pixels in a fixed box gives a blue-band flux of 0.01776 ± 0.01919 µJy: the measured signal is smaller than its formal error.
Under that error model, the positive longer-to-shorter wavelength ratio has no finite upper 95% bound. Stronger correlation between spectral errors can also remove the upper bound. These alternatives reuse observations and are correlated, rather than independent confirmations.
A model in which the underlying light changes slope but stays continuous at 3646 Å, with overlapping emission added, describes the two strong-contrast spectra nearly as well as the same model family allowed a jump.
This is a conditional description of the spectrum. It does not separate the physical light sources or prove that an edge is absent.
RUBIES-BLAGN-1 remains near a band ratio of three under these extraction choices. RUBIES-UDS-182791 remains a weak-contrast case and has substantial differences between its spectrum and the fitted model.
The exploratory extension retains the same three objects, the original measurements and the unsuccessful fits.
Code & sources
Public repository for the three-object JWST analysis
Original contrasts, extraction checks, model assumptions and failures
JWST, RUBIES and archive provenance with source qualifications
The Cliff’s spectrum, faint blue light and interpretation limits